
Fibonacci Retracement Strategy in Crypto: A Professional Trading Guide with Support and Resistance Levels

Updated: Mar 4
The cryptocurrency market is an environment where technical analysis tools are widely used due to its high volatility, sudden price movements, and emotionally driven investor behavior. Among these tools, one of the most popular and frequently discussed methods is the Fibonacci Retracement strategy. It is commonly used in Bitcoin and altcoin markets to identify correction levels, determine potential support and resistance zones, and optimize risk management.
Fibonacci Retracement is not just a few lines drawn on a chart. When used correctly, it helps measure the strength of a trend, evaluate pullbacks, and build a disciplined trading plan. When used incorrectly, it can repeatedly place traders in losing positions. For this reason, Fibonacci should not be applied mechanically but understood logically.
In this comprehensive guide, we will explore the mathematical foundation of Fibonacci Retracement, how it works in the crypto market, why certain levels are important, how professional traders use it, and the most common mistakes to avoid. We will also examine risk management and psychological discipline as essential components of the strategy. For traders who want to deepen their technical analysis skills, our crypto academy provides structured lessons that connect chart theory with practical trading frameworks.

What Is Fibonacci Retracement and Why Is It Important?
Fibonacci Retracement is a technical analysis tool used to estimate potential pullback levels after a price movement. Its main purpose is to determine how much of a correction may occur following a strong uptrend or downtrend.
In the cryptocurrency market, price movements are often sharp and aggressive. The corrections that follow these moves can create opportunities or risks for investors. Fibonacci levels assume that these corrections are not random but tend to occur within specific proportional ranges.
This method is based on the Fibonacci number sequence. Starting with 0 and 1, each number is the sum of the two preceding numbers. This sequence is associated with ratios frequently observed in nature and financial markets. The 0.618 ratio, known as the golden ratio, plays a critical role in technical analysis.
In crypto markets, investor psychology often leads to collective behavior. Fibonacci levels represent areas where this collective behavior tends to concentrate. In other words, price reactions at these levels often occur because many technical traders focus on the same zones.
What Are Fibonacci Levels and What Do They Mean?
The most commonly used Fibonacci Retracement levels are 0.236, 0.382, 0.5, 0.618, and 0.786. Each level represents a different depth of correction.
0.236 Level
This level is typically seen in very strong trends. The price makes only a shallow correction and continues in the direction of the trend. If the price pulls back only to 0.236 and resumes upward movement, it indicates strong market momentum.
0.382 Level
This represents a moderate correction level. In a healthy uptrend, it is normal for price to retrace to this level. Many traders monitor this area for trend continuation signals.
0.5 Level
Although not directly derived from the Fibonacci sequence, the 0.5 level is psychologically important in the market. It represents a half retracement of the move and often reflects profit-taking and repositioning behavior among investors.
0.618 Level
Known as the golden ratio, this is the most critical Fibonacci level. A pullback to this level often forms a strong support or resistance area. Professional traders frequently plan their primary entries around this zone.
0.786 Level
This is considered a deep correction level. If the price retraces to this level, the probability of trend weakening increases. However, the possibility of a reversal still exists.
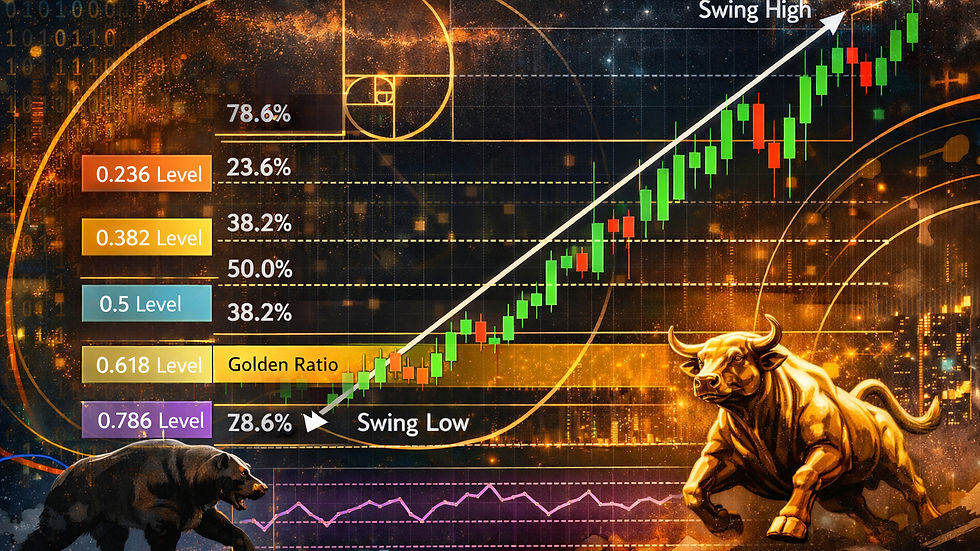
Fibonacci Retracement Strategy in Crypto: How to Draw a Retracement Line?
If Fibonacci is not applied correctly, it can produce misleading results. Therefore, it is essential to understand the drawing logic.
First, identify a clear swing low and swing high on the chart. In an uptrend, draw the Fibonacci tool from the low to the high. In a downtrend, draw it from the high to the low. The distance between these two points determines the retracement levels.
The most critical factor here is selecting the correct swing points. Instead of using random small candle movements, clear structural turning points should be chosen. Otherwise, Fibonacci levels will not produce meaningful results.
Timeframe selection is also important. Fibonacci drawn on a daily chart may produce different results than one drawn on a 15-minute chart. Higher timeframe levels are generally stronger and more reliable.

Trade Entry Methods Using the Fibonacci Strategy
Fibonacci is not a magical tool on its own. It must be supported by a proper strategy. Professional traders combine Fibonacci with other indicators.
Trend Continuation Strategy
In a strong uptrend, traders often wait for the price to retrace to the 0.382 or 0.5 level and then enter in the direction of the trend. Stop loss is usually placed slightly below the next lower Fibonacci level.
Golden Ratio Entry Strategy
The 0.618 level is the most commonly monitored entry area. When price reaches this level, traders look for confirmation through increased volume or bullish candlestick patterns. The risk-to-reward ratio is often favorable at this level.
Fibonacci and RSI Combination
If price approaches the 0.618 level while the RSI enters the oversold zone, the probability of a reversal may increase. This combination provides additional confidence for traders.
Fibonacci and EMA Usage
If price finds support at the 0.5 Fibonacci level while also being above the 200 EMA, this creates a strong confluence zone. When multiple technical factors align in the same area, trade quality improves.
Setting Stop Loss and Take Profit
Fibonacci can be used not only for entry points but also for exit planning. Stop loss is typically placed just below the next lower Fibonacci level. This ensures that if price moves into the next correction zone, losses are limited.
When determining take profit, previous highs or Fibonacci extension levels may be considered. Maintaining a risk-to-reward ratio of at least 1:2 helps ensure long-term sustainability.
Most Common Fibonacci Mistakes
Many investors misuse Fibonacci and experience poor results.
Selecting incorrect highs and lows is the most common mistake. Clear structural turning points should be used instead of minor candle fluctuations.
Opening trades at every level is another serious mistake. Fibonacci levels represent potential reaction zones, not guaranteed reversal points.
Ignoring the trend direction is risky. Entering a long position in a strong downtrend simply because price reached 0.618 can be dangerous.
Using Fibonacci alone without volume, momentum, or market structure analysis is also a mistake.
Does Fibonacci Really Work
The effectiveness of Fibonacci largely comes from market psychology. When many traders watch the same levels, these zones can become self-fulfilling areas of reaction.
However, in sideways and directionless markets, Fibonacci levels may be less reliable. Without a clear trend, the concept of retracement loses its significance.
For this reason, Fibonacci works best in trending markets. It is ideal for analyzing corrections after strong upward or downward movements.
Risk Management and Psychological Discipline
Technical analysis knowledge alone is not enough. Risk management must be the primary focus when applying a Fibonacci strategy.
Each trade should risk only a small percentage of total capital. Opening oversized positions and aiming for huge gains in a single trade is not sustainable.
Patience is also essential. Waiting for price to reach predetermined levels requires discipline. Early entries often lead to unnecessary losses.
Emotional decisions render Fibonacci levels meaningless. Panic selling or FOMO-driven trades fall outside the strategy framework.
Using Fibonacci in Bitcoin and Altcoins
Bitcoin often responds well to technical analysis due to its high liquidity and institutional participation. Fibonacci levels can produce clearer reactions in such markets.
Altcoins, on the other hand, tend to be more volatile. Wider stop losses may be necessary.
Fibonacci tends to work more reliably on high market-cap coins, while lower-liquidity projects carry higher manipulation risks.
Can Fibonacci Be Used for Scalping
Fibonacci can also be applied to short-term trading, but lower timeframes introduce more market noise. Therefore, additional confirmation is required.
In scalping strategies, the 0.382 and 0.5 levels are often used as quick reaction zones. However, because trade duration is short, risk control must be even more precise.
Conclusion
The Fibonacci Retracement strategy in crypto is a powerful technical analysis tool when used correctly. However, it is not sufficient on its own. It should be supported by trend analysis, volume data, momentum indicators, and proper risk management.
Fibonacci levels are not magical lines but potential zones where investor behavior tends to concentrate. When applied within a disciplined trading plan, they can optimize entry and exit points.
To become a successful trader, Fibonacci must be applied with understanding rather than memorization. Long-term success depends not only on technical knowledge but also on psychological resilience and risk control.
If you regularly backtest your Fibonacci strategy, remain patient, and stay committed to capital management principles, you can execute more controlled and structured trades in the cryptocurrency market.


Comments